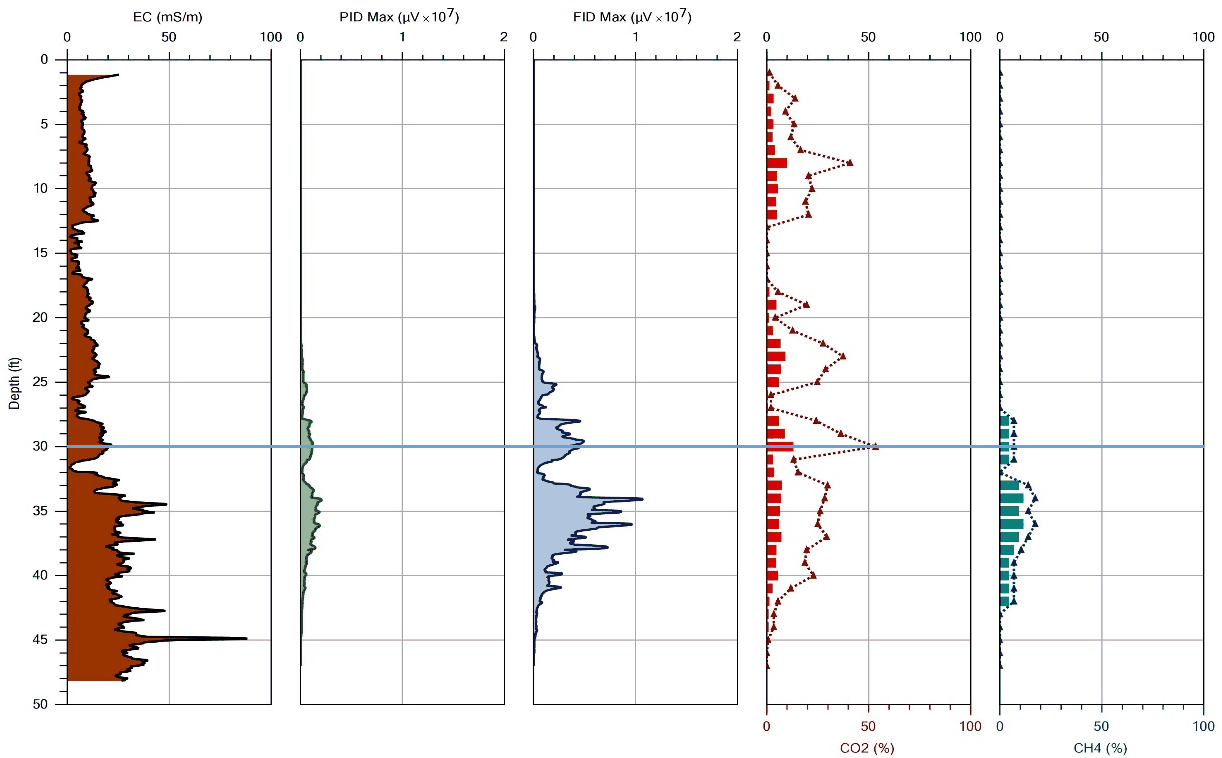
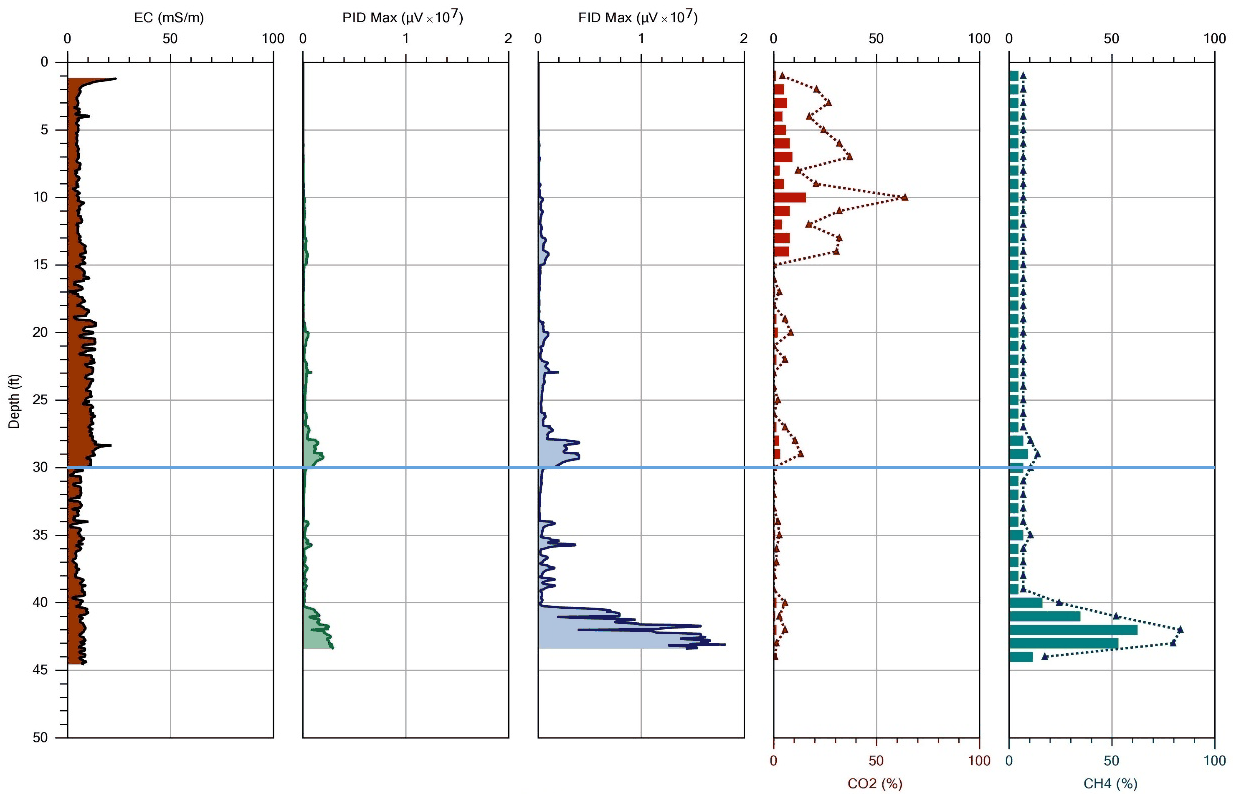
40 feet BGS
Some CO₂ and CH₄ concentrations.
But no CO₂ mass flux, and low CH₄ mass flux.
Potential of some anaerobic biodegradation nearby.
Go beyond “Map contamination”.Measure biodegradation.Make better remediation decisions.
We add real-time measurement of oxygen, carbon dioxide and methane to membrane-interface-probe investigations. These additional measurements reveal the location, type and level of active biodegradation occurring underground.
Locate where biodegradation is occurring.
Identify aerobic or anaerobic conditions.
Add a dynamic biological layer to your data.
Evaluate Natural Source Zone Depletion (NSZD) vs active remediation.
The Challenge
Traditional investigations identify where contaminants are present. But vapor concentration alone doesn’t reveal if chemicals are degrading.
Because vapors migrate through soils of varying porosity and moisture, a detectable concentration may indicate presence without showing the source, preferential migration pathways or whether an active biodegradation process is occurring nearby.
Traditional Measurement
How much is here?
Measures vapor concentrations — is contaminant around here?
EcoRemediation Approach
How much biodegradation processes are active in the surrounding soil?
Measures gas concentrations and mass flux — how rapidly the surrounding formation is supplying these gases.
Patent Pending
The Technology
Our technology enhances membrane-interface-probe (MIP) investigations by measuring three key gases in real time.
Oxygen, carbon dioxide and methane provide vital information about subsurface conditions and biodegradation activity.
Oxygen profiles contribute information about aerobic subsurface conditions and activity.
CO₂ concentration and flux patterns can help locate zones where aerobic biodegradation may be taking place.
Methane concentration and mass flux can indicate zones associated with anaerobic biodegradation.
How It Works
A MIP probe is advanced through the soil to investigate different depths.
Compounds from the formation pass through the probe’s micro-porous membrane. Clean nitrogen sweeps the inside and carries them to the surface.
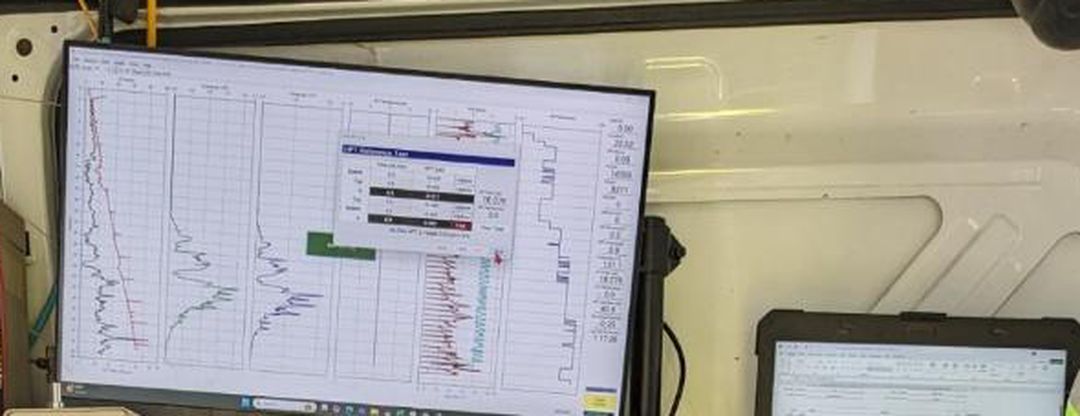
Oxygen, carbon dioxide and methane are measured in real time along with contaminant vapors.
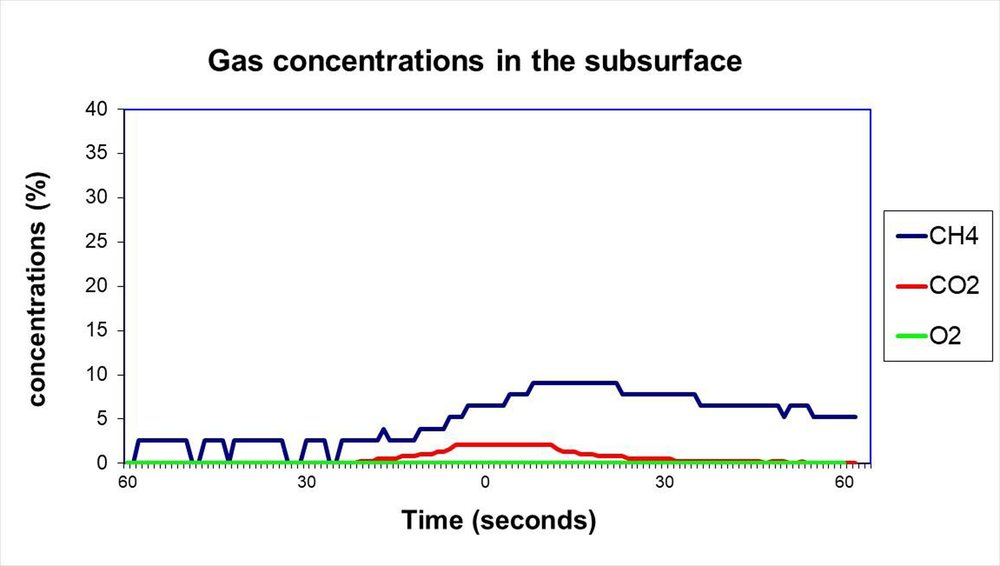
When the probe is stationary, we obtain gas concentrations and mass flux — how rapidly the surrounding formation is supplying the gas.
Locate where natural processes are occurring.
Distinguish aerobic vs anaerobic activity and its strength.
Add a dynamic biological layer to physical and chemical data.
Evaluate Natural Source Zone Depletion (NSZD) with accurate data vs active remediation.
Gain more insight from the same investigation with minimal additional cost.
Applications
Results & Validation
A concentration reading tells us that a compound has been detected. A mass-flux measurement provides a different kind of information: is the surrounding formation continually supplying that gas?
The permeation study of May 2025 tested oxygen, carbon dioxide and methane across the full 0–20.8 % range. Permeation rates for the three gases are similar, and the mass transfer through the membrane appears quite steady.
The membrane is sintered PTFE powder in a stainless-steel mesh. Transport through it follows a pore-flow model driven by a pressure gradient, so the flux through the membrane is proportional to the gas-phase pressure outside it.
Estimate of gas concentrations beside the MIP
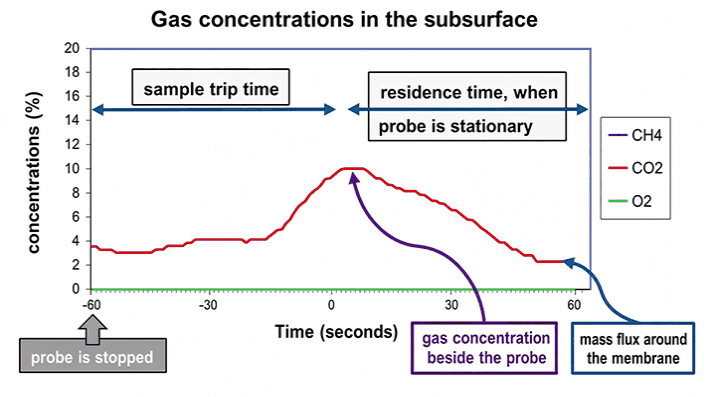
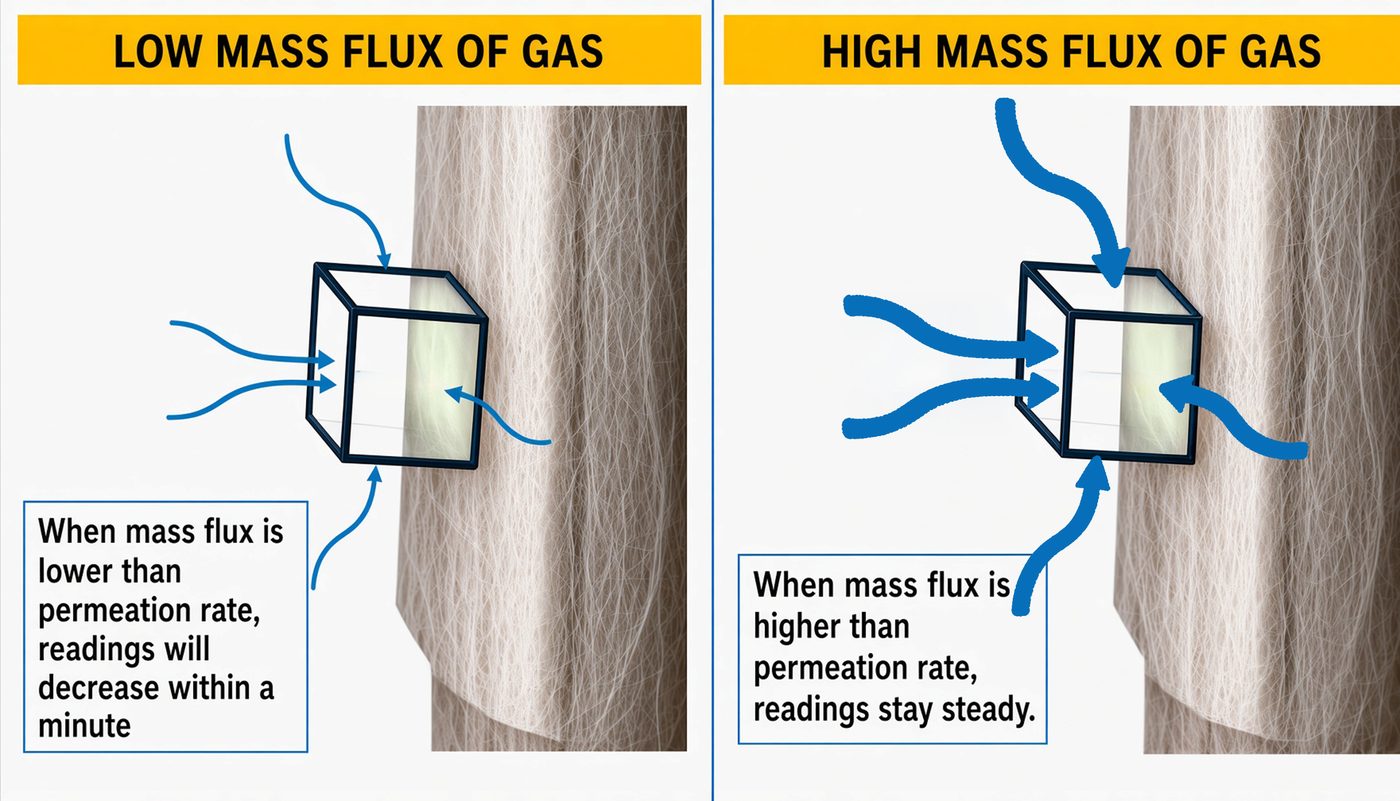
(Examples of readings obtained during a field demonstration: Location B)
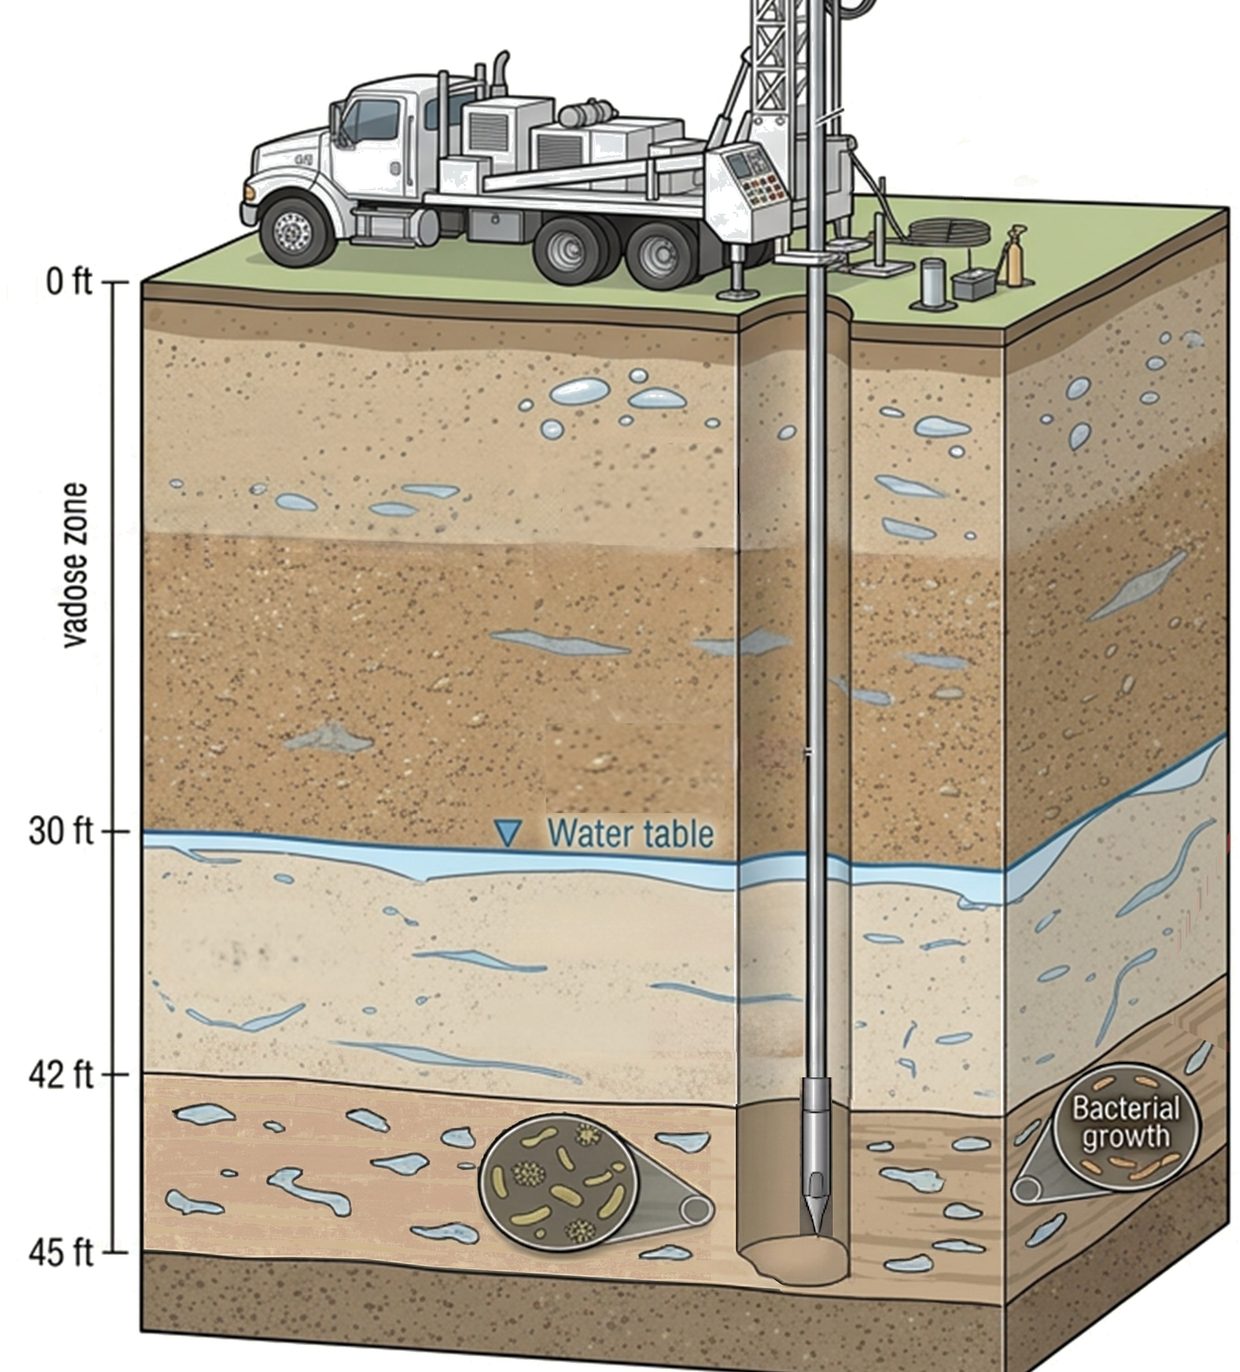
40 feet BGS
Some CO₂ and CH₄ concentrations.
But no CO₂ mass flux, and low CH₄ mass flux.
Potential of some anaerobic biodegradation nearby.
42 feet BGS
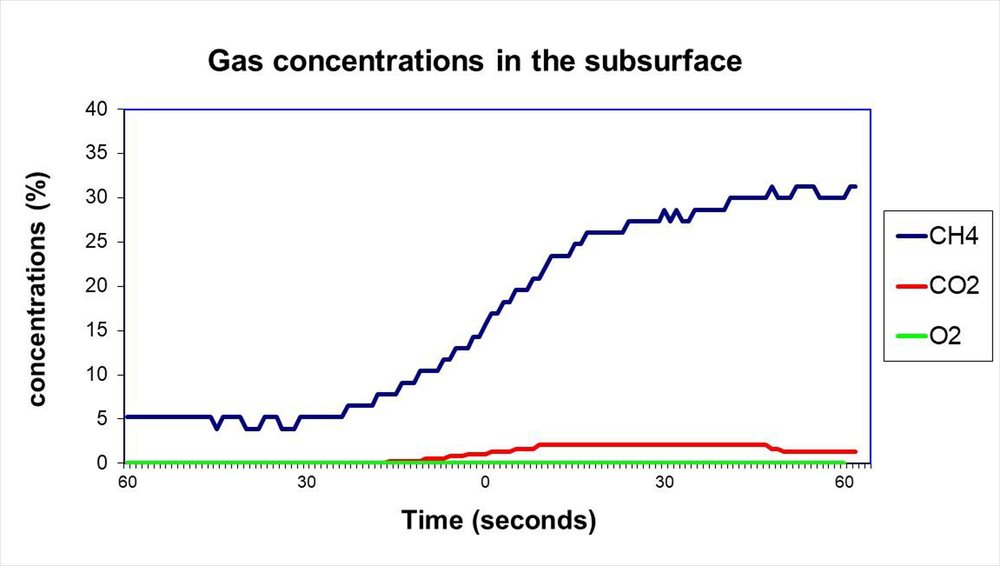
Some CO₂ and no mass flux.
But high CH₄ concentrations and mass flux.
High anaerobic biodegradation beside membrane.
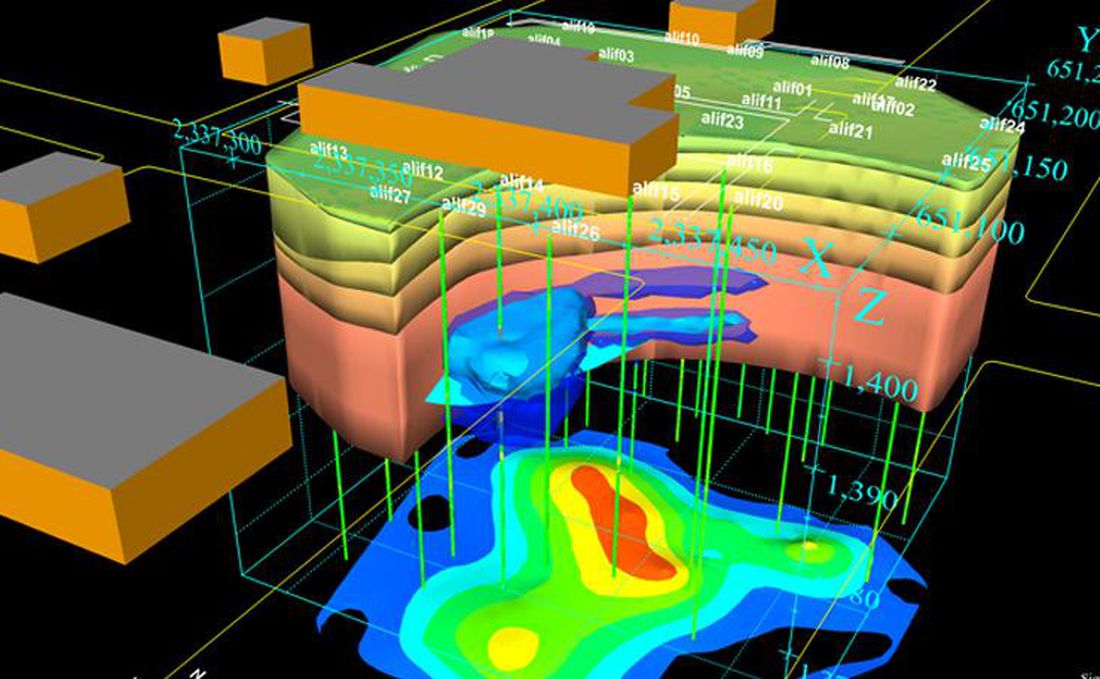
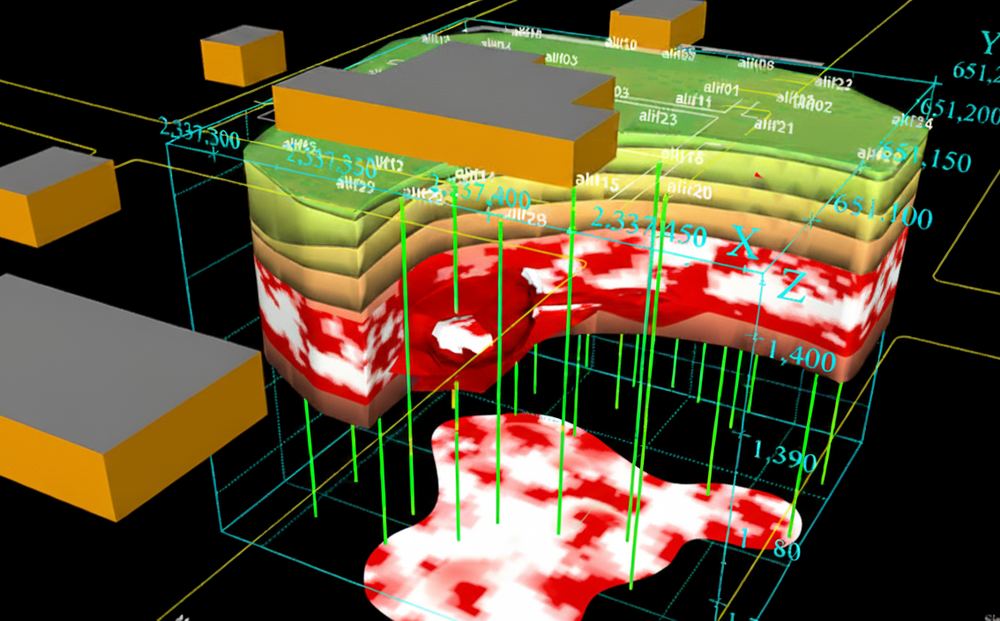
Integrate gas analysis during preliminary HRSC.
Innovation
A gas can be present without an active process nearby.
Since the mid-1990s, membrane-interface probes have been used to locate contamination by analysing vapours. The equipment has focused on vapours alone since its inception.
The behaviour of the two is markedly distinct, particularly in how they migrate through soils of varying porosity. Adding gas detectors to an instrument built for vapours is what makes biodegradation visible.
A substance that exists in a liquid state at standard temperature and pressure.
Benzene, trichloroethylene, water
A substance that exists in a gaseous state at standard temperature and pressure.
Oxygen, methane, carbon dioxide
Three detectors were integrated so the gases in the instrument’s effluent could be analysed alongside the contaminant vapours.
Together they give real-time, semi-quantitative assessments of gas concentrations in the formation beside the probe.
Determine whether gases are simply present or actively being supplied by the surrounding formation.
Identify where biodegradation appears to be occurring, not simply where contamination has been detected.
Add a dynamic biological layer to the contaminant distribution.
The innovation can be incorporated into a preliminary investigation without significant additional cost.
About EcoRemediation
EcoRemediation Inc. is an environmental consulting business based in Montreal, Quebec, led by Andre Tartre.
The practice adds real-time measurement of oxygen, carbon dioxide and methane to membrane-interface-probe investigations. These additional measurements reveal the location, type and level of active biodegradation occurring underground.
The approach is designed to add information to a conventional preliminary site investigation rather than to create an entirely separate investigation program — during a preliminary investigation across the whole site, or during an update of the Conceptual Site Model, on the same mobilization.
Conventional site investigation shows where contamination is. This technology adds information about what is actually happening there, whether natural biodegradation is active, where it is active, and how strongly it is occurring.

Andre Tartre
Founder, EcoRemediation Inc.
Add real-time gas and biodegradation assessment to your next site-characterization program.
Contact Us
Have a contaminated site under investigation? Write to us about adding real-time gas and biodegradation assessment to your next site-characterization program.
Write to
Useful things to include